Anatoly Pachkov, the front-end developer in Qualium Systems, gives a practical advice on how to build a D3.js chart for website created with AngularJS.
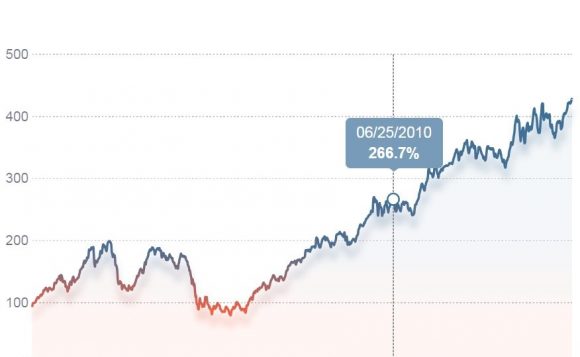
For the purpose of the project, I needed to build two graphs for a single-page website created with AngularJS. The first graph – a Donut Chart with seven parts, the second one – a Line Chart with a period of few years and daily data.
First I looked what’s already available for this purpose on the web, because I didn’t want to spend much time on that. I found a lot of libraries that provided their own, prepared templates for this kind of graphs. Those that matched my purposes were: Google Charts. Interactive and free tool with a large variety of graph forms (including Intervals, Scatter Carts, Gauge Charts etc.)
1) Google Charts. Interactive and free tool with a large variety of graph forms (including Intervals, Scatter Carts, Gauge Charts etc.)
2) ChartJS. Provides free HTML5 based web charts (only five different forms are available).
3) Highcharts JS. It’s a JavaScript charting library based on SVG and VML rendering. This is a truly powerful tool that gives a large variety of Chart types and graphic forms with plenty of design solutions. Free only for non-commercial use.
4) NVD3. It uses D3.js library as a basis. A young project with a variety of available Charts.
NVD3 suited me best among free technologies, because it has prepared directives on its basis, which could be very easily used in the application. But there was a problem – not enough flexibility. Settings that provided these guidelines through its APE were not enough to convey all the details of the design charts.

As a result, I decided to make unique style graphics from scratch with the help of D3.js library, which, though, does not provide ready-made solutions, but gives you complete freedom of action. At first glance, it seemed very difficult and I thought it would take too much time, but in practice it turned out that using this library together with AngularJS is quite effective and easy (when you understand the basic concept of the library).

For the line graph I have created 3 objects (a line, a shadow and a shading below the line), 1 filter and 1 gradient. Here’s the shadow appearance in Line Chart:

And here’s the location of this shadow:

Vertical bar consists of two elements – a line and a circle:

As for Donut Chart, I used available template from the web, but the most interesting part was data-binding with AngularJS. And that’s how I did it:


Thus, the task was performed and everything looked according to specifications, unique and with a responsive design.


